

Semi-structured interface in collaborative problem-solving
The subjects were allowed to use a sheet of paper in order to write down whatever they liked. In most of the cases, the subjects used the instruction sheet containing a list of 16 events by adding a checkmark near the events they had already put on the screen. They also wrote down the time and room they had chosen for a particular event. It seems that a clear representation of work completion was lacking in the problem representation window. The system could be enhanced in this respect by adding an automatically updated checklist which following Smith' terminology corresponds to tangible instrumental knowledge.

The independence test doesn't tell us anything about relations between specific values of the content and the interface usage frequencies. The question is: does a higher freqency of use of the structured interface go along with a higher frequency of task-related utterances?
We can notice following correlations:
| Task frequency | Strategy frequency | Management frequency | |
|---|---|---|---|
| Structured frequency | .7420 (p<.05) | .8284 (p<.05) | .6185 (NS) |
| Free frequency | .3393 (NS) | .6022 (NS) | .7455 (p<.05) |
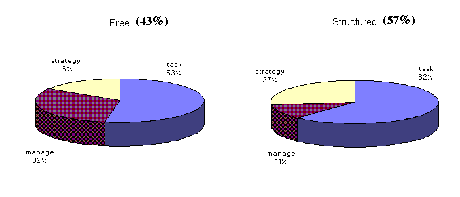
We observed that pairs tend to prefer one section to the other and keep this preference during the whole interaction. The correlations we just presented show that pairs which prefer the free section of the interface also tend to produce management utterances with a higher frequency and that pairs who tend to prefer the structured interface, produce task and strategy related utterances with a relatively higher frequency (See Table 1: "Expression mode and content type"). Baker & Lund (1996) showed that more 'off-task' utterances were produced by subjects using a chat interface than by subjects using a structured, dedicated interface.
Now this is not true in our experiment: monotony is negatively correlated to the frequency of strategy related utterances (r=-.5686, 1-tailed p<.05), to the frequency of task related utterances (-.8485, 1-tailed p<.05) and to the frequency of use of the structured interface (r=-.5867, 1-tailed p<.05). This indicates that some pairs did not verbally coordinate their actions when positioning the events on the problem representation. Two hypothesis could explain this unexpected phenomenon. Either only one subject was acting while the other was watching or the subjects split up the task before starting to act on the problem representation.
1) Collaborative activity implies tuning activities, i.e. solutions are constantly reelaborated and renegociated in the interaction whereas an individual executes his plan once he has fixed it up without further questioning. Pairs in which a strong leader emerges and takes control of the problem solving should then be less monotonous because one individual does most of the work. We computed an asymmetry index[6] on actions and communication to test this possibility but monotony is not significantly correlated to any asymmetry index. However, the action asymmetry index is negatively correlated to the frequency of actions (r=-.695, 2-tailed p<.05) which means that the more symmetric a pair is, the more actions are produced.
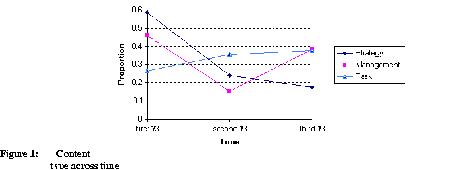
2) Collaboratively acting on the problem representation was difficult, almost impossible due to a blocking mechanism (See "Co-action" section). Pairs who did not split up the task and tried to do the positioning of events together must have had more coordination problems. Pairs who split up the task and distribute the roles could then act individually on the problem representation and be more accurate. Our assumption is that strategy has to be discussed in the beginning of the interaction. We chose to partition the interaction into three phases in order to check if early strategic negociation is related to monotony. We characterize these phases as follows:
a) a management and strategic oriented phase where subjects initiate contact and distribute roles and work. (high management and high strategy proportions)
b) a task realisation phase where we have a high proportion of task related utterances
c) a control and congratulations phase where task and management proportions are high ("au revoir" phase)
This distribution is supported by our data when looking at the mean proportions of utterances by type (strategy, management and task, see figure 4). Of course, representing the mean values hides the specificity and variability of pairs.
How can we explain that some pairs have a lower monotony? We should have two types of interaction: a first one where strategic utterances are spread across the whole interaction time and another where strategy is discussed mostly at the beginning of the interaction.
We computed the relation between total monotony and proportions of strategic utterances per thirds of total time. The critical correlation with respect to our hypothesis is between the proportion of strategy during the first third of time and the monotony (See Table 2: "Monotony and proportions of strategy"). It indicates that when a high proportion of all strategic utterances are produced in the first third of the total time, the total monotony will be higer too. The proportion of strategic utterances in the two next thirds of time are negatively and non significanty correlated to monotony (This lack of significance is partly due to the small number of pairs we have at our disposal).
| Strategy first 1/3 | Strategy second 1/3 | Strategy third 1/3 | |
|---|---|---|---|
| Monotony | .6463 (p<.05) | -.5365 (NS) | -.5308 (NS) |
As presumed, the pairs which spoke about strategy in the beginning end up with a lower monotony index. We don't think that these pairs are better collaborators than those which did not split up the task or the roles. However, given the properties of the system which hampered joint manipulation of events, splitting up the task seems to be optimal.


Generated with Harlequin WebMaker