Producing initial ideas
Material to be presented via diagram needs to be treated as central to the exposition,
not just as icing on the cake.
Instructional diagrams are integral components - not optional extras.
At an early state of the design process, make a thorough analysis of
- audience,
- content,
- objectives,
- distribution of responsibiliy for explanation between diagrams, text and other components.
Steps:
Brainstorming the subject matter for an unstructured collection of ideas.
Organizing this material: grouping, relations.
Clarifying subject matter and purpose of each diagram.
Select the graphic material that will make up the diagram.
First visualizations:
- variety of views: side, top, bottom, profile,
- different levels of detail: close-up, long shot,
- assembled, partly disassembled, as separate parts,
- different lighting: to highlight or clarify aspects,
- various states.
For a process diagram, taking a video may help: chose particular frames for best capture of key states.
Developing the entities
Produce an initial sketch to set out the main features you want to depict.
Photocopies of photographs are very useful for this task.
Another starting point for the visualization: a verbal or mathematical description
with as much information as possible about the components and structure.
Assign visuo-spatial representations to the subject matter.
Visualization must have some accepted association with the subject matter.
Strip it down to its bare essentials, but leave enough for picking up the message.
Help the viewer to interpret the information by using:
Boxes and circles: grouping entities, drawing attention, marking transformations.
Arrows: specifying the sequence in reading, bringing to attention specific features.
Avoid confusing the viewer.
Dashes or dotted lines: helping the viewer make comparisons.
Labels and explanatory notes: identifying entities, adding extra information, guiding the viewer's interpretation;
means: letter, numbers, symbols.
Treatment of entities
The realism used in the graphic treatment to depict the entities may be of high or low degree:
- similar appearance: supporting identification,
- arbitrary graphic forms: showing relationships, acting as tokens, focusing on overall arrangement and broad overview.

The rendering has to be considered as well: lines, shading, colours.
Knock back secondary contextual informations in order to keep main subject matter central by using:
- lighter line weight,
- dotted lines,
- shade of grey,
- lightly shaded background.
Beware of techniques that add visual confusion to the diagram.
Uniform shading is preferable since it keeps the display simple.
Keep rendering techniques simple too. Do not make areas seem very busy.
Keep the supplementary entities (arrows, boxes) simple and helpful.
Create sufficient contrast between the background (ground) and the entities presenting the subject matter (field).
Reduce the amount of detail and graphic emphasis in the background to a minimum.
Close spacing: few empty space between entities belonging together.
Wide spacing: more empty space to separate items.
Assembling entities into a diagram
Diagrams are powerful in supporting our well-developed capacity to process visual patterns.
Good diagrams facilitate appropriate processing by their neat and clear arrangement of the entities
Spatial arrangement includes:
Real-life spatial arrangement of the material to be represented in the diagram.
Non-spatial relationships that are to be represented spatially in the diagram.
Spatial aspects of transformations that will be used in the diagram for powerful presentation.
Clarity that will result.
Information load for the viewer: we can deal with about seven information chunks at one time.
Learner's expectations: the way target learners will be likely to read,
where critical pieces of informations are likely to be expected, sequence of exploration.
Overall graphic design, aesthetically balanced display.
Non-spatial relations
How to show non-spatial relationships in a spatial manner?
- Ordering entities represents some organizational principle present in real-life non-spatial relation.
- Distance between entities represents the closeness of the relations.
Formal types of arrangement:
- sequences: arranged along a single line (timelines),
- networks: two-dimensional array (tree diagram, classification).
Be consistent in the way you use space to represent non-spatial relations.
Four common types of non-spatial relations depicted spatially in diagrams:
Temporal
Differences in time are shown as differences in position.
- left or top = earlier
- right or bottom = later
More complexe arrangement: cycle
Hierarchical
Items arranged according to their significance in a situation or process.
Part-whole
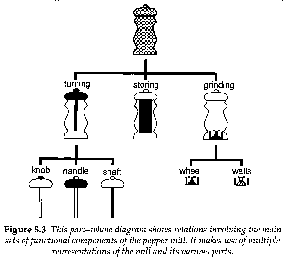
Showing the way the whole can be broken down into its component parts.

Emphasizes the functional relationship of the parts to the whole
by disrupting the real-life spatial relations.
Class membership
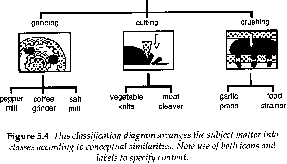
Categorizes the subject matter as a convenient summary of similarities and differences.
 The figure above categorizes all the items used in kitchen for subdividing food into smaller pieces.
The icons shown function as token. Conceptually related items are organized into groups.
These four arrangements expose significant relations, key features of the content.
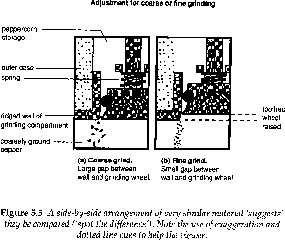
Another type of arrangement invites the viewer to process the informations.

This side-by-side arrangement promotes effective learning: it invites to compare and contrast two representations.
Technological aids for diagram production
How to get the image into the computer:
Make an overhead transparency from the photograph. Tape it on to the monitor screen. Draw it with the mouse.
Attach the photograph to a graphics tablet. Trace it over with the pen.
Scan the photograph or the object itself. Drap over the object a white cloth.
Take a digital image with a digital camera.
Connect video camera to the computer, capture a still image with frame grabber.
Make a video, from different angles and distances., capture still images from the video tape.
The digital picture can be worked over: producing line drawings of relevant parts.
Operations:
- altering brightness and contrast,
- sharpening the image,
- outlining the edges of the image,
- converting image for tracing,
- electronic editing to produce several frames for a composite.
For high-quality diagrams: use programs that define images
by means of mathematical descriptions (bezier curves) rather
than as a collection of pixels: drawing software - not painting.
Output on high-resolution printers.


