[English] [Français]
Eduswiss diploma work 2002/2003
PathFinder
Web Navigation Path Visualization
|
Student: Supervisor: Expert: |
Pierre Dillenbourg Luc Girardin |
Abstract
Nowadays, the World Wide Web is used by an increasing part of the population. E-business has become a common way of purchasing for many people. In response to the general enthusiasm for this new media, companies are interested to know what attracts customers to their websites. This information is crucial to the analysis of their markets. Technically, e-business is based on standard web technologies such as web servers and browsers. A customer browsing a company website leaves traces in the form of log files generated by the server. When analyzed, those files reveal significant information about the customer's on-line activity. PathFinder is a system that analyses web server log files. It displays the website structure and the customers navigation paths in a 3d visualization.
Objectives
PathFinder aims at helping website designers and administrators to discover the standard navigation paths of the website and to use this information to improve the site content and ergonomics. It is built in order to answer 3 fundamental questions:
What paths are used to reach a specific page?What paths are typical of a specific time/date?What pages are often/rarely accessed?
As a prototype, PathFinder does not intend to compete with existing commercial products. It rather explores an alternative way of communicating web usage information. Instead of classical charts or tables, PathFinder represents the website structure in the form of a 3d cone tree. The 3d cone tree is a known and efficient method for visualizing large hierarchical structures.The idea of the cone tree is to display each node at the top of a 3d cone and to arrange the nodes hierarchically lower around the cone's circular base.
Results
The project was programmed in Java. It can be decomposed in three main parts. The first part is a web crawler (sometimes also called spider or robot) that is used to grab the structure of the web sites. The second part is responsible for the analysis of the log files. The third part, realized with Java3D, controls the 3d visualization.
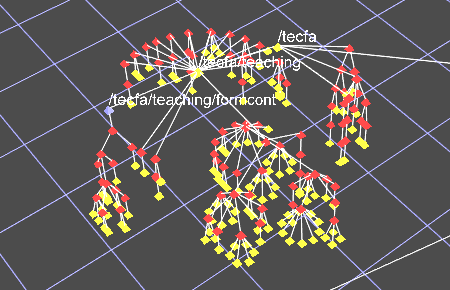
In preliminary tests, PathFinder turned out to be a reasonably functional system. The chosen 3d cone tree visualization showed to be an effective tool for representing web sites. Picture 1 shows PathFinder's visualization of an entire website. Pages are displayed as red pyramids or cubes. The yellow lines represent the hyperlinks. The white lines represent the site's organizational hierarchy. Since every 3d cone has the same height, the hierachical levels are visible.

Picture 1: Entire website with hyperlinks.
Picture 2 represents a
visualization of the hits on a website. Red and yellow indicate a
number of hits respectively below and above a user selected threshold.
Picture 2: Visualization of the page hits.
Picture 3 shows a magnified view of a web site zone where the navigation paths (depicted in purple) can be seen.
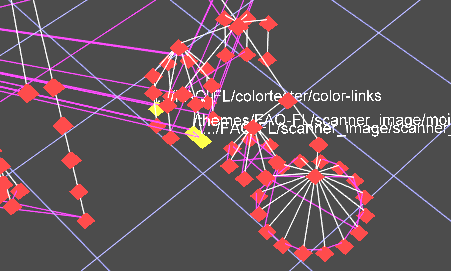
Picture 3: Visualization of navigation paths.
Conclusion
Usability tests have shown
that this system is able to
achieve the goals it was designed for, but it seems that the 3d cone
tree view is more suitable for finding general structural trends than
for a close examination of single paths. However the 3d cone tree can
be a very powerful complement to traditional 2d views. Future
developements will combine 2d and 3d representations. One of the
challenges of the cone tree, in order to be accepted by users familiar
with more traditional representations, is to offer a high-quality and
interactive user interface.
This project allowed me to deepen my knowledge of both Java and 3d
computer graphics. I also enjoyed investigating the paradigm of
information visualization where space, colors and shapes are used to
represent conceptual datasets that lack a natural representation.
Download videos
DivX-5.0: Overview.avi (7.6 MB) Paths.avi (5.5 MB)MPEG-1: Overview.mpg (13.8 MB) Paths.mpg (6.9 MB)
[English] [Français]