 Single Channel AM Experiments Single Channel AM Experiments
 In order to verify the theories on the effects of 'wave interference' and AM discussed in the last section we can analyse the effect of combining sine wave signals by examining their interaction using filter bank analysis. However, since at this time we are only examining the interaction of sine waves with relatively similar frequencies it is only necessary to use a single channel of the filter bank.
The filter bank to be used for these experiments is the auditory periphery gammatone filter bank, based on models of the auditory periphery. The gammatone filter bank provides three different variables of use to us in these experiments, Amplitude, envelope, and Instantaneous Frequenc(IF). By plotting these it is possible to examine the effects of AM in detail, as can be seen below in Figure 1. This shows a plot of the three variables for a 1000Hz CF filter channel containing equal amplitude sine waves of 1100 and 900Hz. As expected, we see the envelope 'beating' at the difference frequency between the component sine waves (200hz =10khz sampling rate / 500 sample period), with the IF at the average of the two (1000Hz).

In this experiment, both to verify the theoretical calculations across the frequency spectrum, and to examine the differences in filter curves at different frequencies, three separate channels will be examined, 300Hz, 1000Hz, and 2500Hz. For each of these channels the frequencies of the component sine wave's are chosen to be equidistant about the CF of the channel. That is that whilst the frequencies move away from the filter CF the difference between them and the CF will always be equal. The tones change frequency up to a difference of 0.6 of the filter CF, the following graph shows the waveform envelope's peak amplitude. The modulation depth and IF remain constant for all readings, at 1 and 1000Hz respectively since the filter curve is symmetrical, making the tones equal in amplitude at all frequencies.

Since the tones are moving equidistantly away from the CF their amplitudes are reducing at the same level, so we are basically seeing the filter curve for each of the three channels. As expected, because we are using an auditory model the BW of the channel reduces as the frequency increases making the curve steeper. This seems to verify the theories on dual sine waves of equal amplitude, in the next experiment we move on to the analysis of the interaction of tones with unequal amplitudes.


As can be seen, the graphs show the expected slope in peak and trough amplitude as the amplitude of the floating tone decreases as it moves away from the filter CF. This shows a change in modulation depth as the dominance of the fixed frequency changes, when the Error Ratio is 0, there will be no interference, the graphs simply show the additive amplitudes of the two waveforms. We also see differences in the slope of the curves caused by differences in the channel BW's, as seen in the previous experiment.

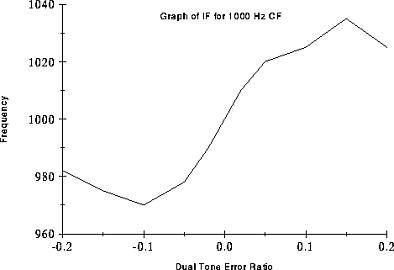
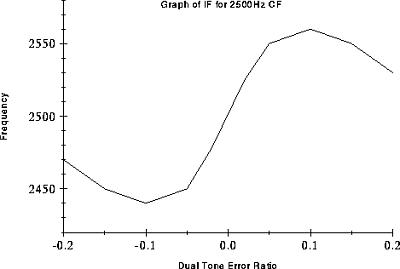
Looking at the graphs of Instantaneous Frequency (measured at peak amplitude) we see two seperate regions of IF change. In the region when the tone difference is within +/-0.1 of the CF the IF is pulled away from CF as the floating tone moves further away from the fixed tone. However, as the floating tone moves away from the CF it becomes attenuated (see filter curve) increasing the fixed tones dominance. Beyond the first region the floating tone's amplitude is reduced to such a level that the fixed tone starts to pull the IF back to the CF. Beyond the scope of the graph we would see the IF slowly return the frequency of the fixed tone as the energy of the floating tone reduces to zero.

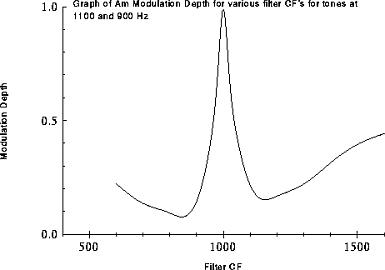
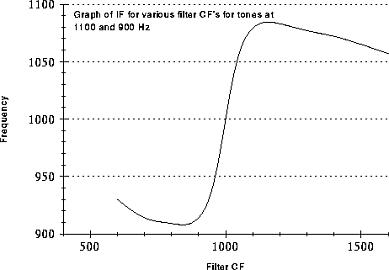
Looking first at the graph of peak waveform amplitude we see a characteristic double peak when the filter CF is at the frequency of the two tones. Modulation Depth shows the expected peak at the mid point frequency between the two tones (1000Hz). This reduces as the CF moves towards either of the tone frequencies, because of the relevent tones increasing dominance, continuing up to a point just beyond the tone's frequency. Beyond this point the modulation depth begins to rise again, this is because the two tones are becoming closer in amplitude as the filter CF moves away from both tones. However, referring back to the graph of peak amplitude we can see that in this region the amplitude of the waveform is nearly negligible. This is coupled with that of the IF readings, showing similar results, AM depth rising again beyond the filter CF's of the two tones.
From the analysis performed in the previous two experiments it seems that there is a relatively simple method behind predicting the characteristics an AM signal with unequal components based on the dominance of one tone over the other. However before further investigation it would be useful to be able to predict the outcome of combining unequal tones, for comparison with experimental results. It is this that is covered in the next section ' AM Theory for Tones with Unequal Amplitude ', showing theory behind both the combination and extraction of tones with unequal amplitudes.


As can be seen, the IF (showed as the dotted line) shows a deviation when nearing the AM envelope trough. However, the deviation is dependant upon which of the tones has dominance. In Figure 12, where the higher frequency tone is dominant, the IF deviation is position, whereas the opposite is true for figure 13, where the lower frequency tone has dominance. Another noticeable effect on the IF deviation is the modulation depth of the AM waveform. As the modulation depth becomes greater the deviation increases, along with a relative reduction in the width of the deviation. This seems to hold even up to the two extremes, i.e. at modulation depths of 0 and 1. At a modulation depth of 1 the deviation is infinitely wide, but of no width, whilst when the modulation depth is 0 the opposite is true.
These IF changes seem to be an obvious pointer to both location and estimation of AM in signals since they appear to be particularly unusual, and so should be relatively easy to locate. However, as well as examining the changes in IF over time it will also be necessary to examine differences in IF over frequency. This will require the use of a number of filter channels, making analysis difficult with the methods used in the previous experiments. Therefore a new method of representing IF changes, and AM is required. This is the subject of the section ' Instantaneous Frequency Plots and AM '.
|